February 21, 2016

QVD Metadata

Examining QVD metadata

Qlikview data files (extension .qvd, referred to as QVD files in this article) are used for intermediate data storage, history, incremental loads and so on. The file contains the full information of a single data table and the files are usually generated and consumed by the load script. The metadata is useful when developing and operating multitier Qlikview setups.

What you may not know is that the qvd file contains extensive metadata for the table. This includes:
  • The name of the qvw file that created the QVD file
  • The version of Qlikview when the load script that created the QVD was run
  • The time the file was created
  • Metadata for the fields (name, number of unique values, data type, width, symbol table offset etc
  • The number of rows in the table
  • Lineage data, including data sources, SQL queries and connection data
This metadata is found in an XML header in the first part of the file. There are several ways of accessing this metadata without loading the entire file

Windows Batch "More"

A simple way to look at the metadata (as raw XML) is to use the Windows batch "more" command running in a console window. To set his up, you need a simple batch file. These are the steps to set this up:
  • Create a text file on your desktop using a text editor (notepad will do, although I prefer Notepad++)
  • Add a single line:   more "%1"
  • Save the file.
If you saved the batch file on your desktop, you can drag a QVD file and drop it on the file icon. A command or console window will open showing the first part of the XML metadata header. Press space to get the next page full. One you get a whole bunch of strange characters, you have reahed the end of the header and are looking at the symbol table which follows the XML header.

This approach is simple, but not always the most convenient way to get the metadata you need.

Powershell Script

To simplify extracting the metadata and displaying it in a clear layout, I have created a Powershell script to extract the XML and unpack the XML elements. Powershell is a standard component of Windows since Windows XP/Server 2003.

If you are not already using Powershell, create a scripts folder: eg C:\Scripts or C:\Users\Fred\Scripts. Download the script ps1 file and copy to the scripts folder you created.

 qvdMeta.ps1

You can use this script using the following command line (type in CMD window):
>powershell C:\Scripts\qvdMeta.ps1 -source

You can add this to a batch file saved on your desktop:

@echo  off
powershell C:\Scripts\qvdMeta.ps1 -source %1

Now drag the qvd file and drop it on this file to see the fie metadata:

QVD Meta data extractor V1

Source file     C:\Data\QVDs\Balances.qvd
Created by      C:\QVDeploy\QVDCreators\Balances.qvw
Qlikview build  12664

No of Rows      231 372
Table name      BALANCES
Build time      2015-12-08 01:26:59

Fields:
  EffDate                                         1 282  values
  RelNo                                             389  values
  Company                                             8  values
  FundCode                                           29  values
  ClientName                                        362  values
  ClientBalance                                   9 855  values

XML lines       201 ; bytes =  6 499:


Note the script has been tested with QVD file produced by QV 11.20 up to SR13. I have not tested it with QVD files produced by Qlik Sense, or QV 12. It may need minor mods.

Open using Qlikview

If you are not interested in the metadata, but want to examine a qvd, you can read the qvd in Qlikview - just drag the qvd and drop on the QV icon on your desktop. This will create a load script. Now click File | Reload, and create some list boxes, and a table box for a quick view of the content.

To view the  metadata only, change the file type in the QV file preview to XML. Now you can load the XML into QV rather than the actual data.




July 13, 2014

Time and Date Confusion 2


Date conversion or interpretation functions

 Qlikview is able to automatically interpret dates that match te format set in your PC locale, or in the the Qlikview environment variables (usually automatically added to the start of the script in a new document)

Set TimeFormat='hh:mm:ss';
Set DateFormat='YYYY/MM/DD';
Set TimestampFormat='YYYY/MM/DD hh:mm:ss[.fff]';

However, the date and time values in your source systems are frequently in a different format. This is where the date interpretation functions come in:

  • Date#(stringvalue[, format])
  • Time#(stringvalue[, format])
  • Timestamp#(stringvalue[, format])
  • Interval#(stringvalue[, format]) 

The functions ensure that the date field is correctly interpreted. So lets assume that the field is in YYYYMMDD format (eg in a load statement):

    Date#(SourceField, ‘YYYYMMDD’) As DateField,

The interpretation functions only affect the numeric value of the dual. The above expression will return the correct numeric value, but the text format will still be YYYYMMDD format, as this what Qlikview inferred as the correct format from the first record. If you would like to corrrectly interpret the date and format it on the default format for you environment/locale, them combine the interpretation function with the relevamt formatting function, like this:

     Date(Date#(‘YYYYMMDD’)) As DateField,
     Date(Date#(‘YYYYMMDD’), ‘D MMM YYYY’) As DateField2,  

The first will produce a date formatted in the default date format and the second in D MMM YYYY format.
Hopefully this post and the previous one helps you to  understand how to use the date/time format and interpretation functions.

Time and Date Confusion 1

Part 1 Formatting Functions


A common cause of issues on the QlikCommunity forum is date fields and the use of the formatting and interpretation functions.

First of all, let me state that there is no specific date data type in Qlikview. There are only two data types in Qlikview – text (or character) and number (or numeric). All number values are actually ‘duals’ – a dual has a text representation and an underlying numeric value. A date is simply a dual value with formatted text representation and an underlying value described below.

The integer portion of a date is the number of days since midnight of December 31 1899. So 1 January 1900 is day 1. July 7 2014 is day number 41827. This is identical to Excel and SQL Server as well as many other products.

The fractional portion of a date/time value represents the proportion of 1 day. So 41827.0 is time 00:00 on 7 July. 41827.25 is 6:00am (0.25 * 24). A pure date has a fractional part of 0. A pure time has only a fractional part (0.000000 – 0.9999999). 

An interval has both parts where the integer part represents days and the fractional part represents portions of a day, So 0.75 is an interval of 18 hours (0.75 * 24) or 1 080 minutes (0.75 * 24 * 60) and 1.5 is an intrerval of 25 hours.

One important point is that the value of the date dual is the underlying numeric, regardless of the chosen text representation.

So lets move on to the formatting functions:

  • Date(numericvalue[, format])
  • Time(numericvalue[, format])
  • Timestamp(numericvalue[, format])
  • Interval(numericvalue[, format])

Where numeric value is the date value and format is the optional format. If the formatted is omitted it will format the value to the default for your environment/locale.

These functions format only the text representation of the date/time dual. The underlying numeric value is not affected. So the text output of the following two expressions are identical, but the values are not equal:

                Date(‘2014/07/10 09:00:00’, ‘YYYY/MM/DD’)  = 41830.375
                Date(‘2017/07/10’, ‘YYYY/MM/DD’) = 41830.000

I have also often seen constructions such as Max(Date(someField)) or Date(someField)+2. The Date() format function is not required in these expressions, and only serves to clutter the expression, and in extreme cases may also affect performance.    

The most important points to take away from this are:

  1. the value of the date is the numeric value of the dual and
  2. the formatting functions only affect the text representation of  the date/time

June 14, 2014

About Table Concatenation

Concatenation

 According to the Qlikview Reference Manual:
If two or more statements result in tables with identical field names, the tables are concatenated and treated as one logical table.
Let’s explore this statement. Consider the load script:

Table1:
LOAD * Inline
[
A, B, C
1, 2, 3
4, 5, 6 ];

Table2:
LOAD * Inline
[ A, B, C
6, 5, 4
4, 5, 6 ];

If you run this script, there will only be one table – Table1. This table contains all 4 lines loaded, including the line 4, 5, 6, which will be loaded twice. Click File | Table Viewer (or Ctrl-T) and check the table contents in Table1.

Now if we add the lines:

Table3:
LOAD * Resident Table1;

Table3 will not be created, as it contains the same fields as Table1 and will be concatenated. Now there will be 8 records in Table1. So if the tables have the same fields, they will autoconcatenate. The field order is unimportant, but remember that QV field names are case sensitive.


Avoiding Automatic Concatenation

If the table is created with different fields, then the second table will not be concatenated. But what if you need to reload the data from the resident table? Add the lines

Table4:
NoConcatenate
LOAD * Resident Table1;

Now Table4 is not concatenated to Table1. (If the scripts end at this point we will have a synthetic key, but that is the subject of another post).

Note that if the second table is created with different fields (a subset of the first table’s fields), then it will not be concatenated, even subsequent statements add the missing field(s) or drop the extra fields. Look at this example:

Table1:
LOAD * Inline
[ A, B, C
1, 2, 3
2, 5, 6
3, 6, 7 ];

Table2:
LOAD A, B
Resident Table1;

 Join(Table2)

LOAD A, (A+B) As C
Resident Table1;

Table2 will be created as a new table because it contains only a subset of Table1’s fields when it is created. This does not change when we add a column C to the table as the table already exists.

So the manual text should more accurately say:
If two or more statements create tables with identical field names, the tables are concatenated and treated as one logical table.

January 12, 2014

Understanding Aggr()

Aggr() is an important part of the toolkit that you need when building more complex expressions and calculated dimensions in Qlikview. This post attempts to demystify aggr() and show it can be used.
 

In a Qlikview chart, such as a straight table, the chart expressions are evaluated for all possible combinations of the dimension. An Aggr() function does the much same, so the expression:

Aggr(Sum(Sales), Region)

Produces a list of the summed values, one for each region. And this:

Aggr(Sum(Sales), Region, Period)

 
Produces an array of sales for each region/period combination. Three dimensions would construct a cube, and so on. 


You may use the aggr() expression anywhere that expects a list or array of values (technically an n-dimensional hypercube). This may include in a list box, a calculated dimension or in a nested aggregation. 

A nested aggregation is where one aggregation function (eg Sum, Min, Avg etc, not to be confused with the aggr() function) is contained within another. For example, lets say you would like to know the lowest possible summed value (eg Min(Sum(Sales))) for the sales outlets. Sum(Sales) will return a single value, but you need a list of Sum(Sales) by store. This is where aggr() comes in.  The expression becomes    

Min(Aggr(Sum(Sales), Store)) 


For another example, Lets say you want to know the lower 5% and upper 95% percentile of sales by Store:

Fractile(Aggr(Sum(Sales), Store), 0.05)
Fractile(Aggr(Sum(Sales), Store), 0.95)


If the data was arranged in months, and you wanted the expression should be calculated to each month (in a chart with month as a dimension):

Min(Aggr(Sum(Sales), Store, Month))
Fractile(Aggr(Sum(Sales), Store, Month), 0.05)
Fractile(Aggr(Sum(Sales), Store, Month), 0.95)

 
If you have more than one year, you would of course need to have a single year selected before using this chart/table, or you could do something like:

Min(Aggr(Sum({} Sales), Store, Month))
Fractile(Aggr(Sum({
} Sales), Store, Month), 0.05)
Fractile(Aggr(Sum({
} Sales), Store, Month), 0.95)

Aggr() expressions in a chart

 
When you use an aggr() in a chart, it is important to always include ALL the chart dimensions in the aggr() dimensions. This allows the expression to be calculated correctly in each cell in the chart or table.


This can present a problem if you are using calculated dimensions, as the dimensions in the aggr() statement have to be fields, not expressions. If the calculated dimension is simple and based on a single field, and each value corresponds to a single value of that field, then you may be able to use the field name in the aggr() expression.

January 6, 2013

Paged charts in Qlikview

Qlikview does not have a built-in paging mechanism for charts and tables. By paging, I mean returning a portion of the results (say top 5 salespeople), with "next" and "previous" buttons to view other portions - in the same way a web search with Google or Bing returns one page at a time.

To illustrate, this is a simple paged chart in Qlikview:
 

Here's how to do it.
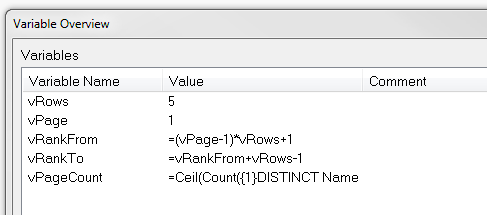
  • Create the following variables
    • vRows - contains the number of rows to display per page - 5 in this case
    • vPage - the page number. Initialise to 1 for the first page.
    • vRankFrom - the expression  =(vPage-1)*vRows+1
    • vRankTo - the expression  =vRankFrom+vRows-1
    • vPageCount - the expression  =Ceil(Count({1}DISTINCT Name)/vRows)
    • Note the = sign on the three expressions
    •  
    Set these variables


  • Create 3 text boxes
    • "Previous" or "<<"
      • Lable the first one "<<" or "Prev" (or whtaver makes sense in your situation). 
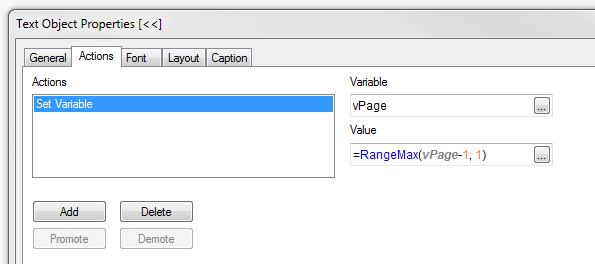
      • Create a set variable action for vPage with the following expression:
        =RangeMax(vPage-1, 1)
        .
        The RangeMax ensures that vPage will not be less than 1.
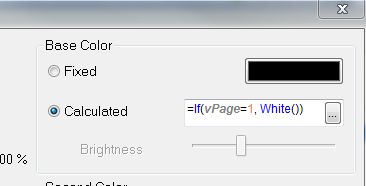
      • Optionally set the font colour to black, and add the following calculate colour expression:
        =If(vPage=1, White())
        (Set to whatever colours you like to indicate active and disabled states)
    • "Next" or ">>"
      • As above, but use =RangeMin(vPage+1,vPageCount) for the vPage set variable action and =If(vPage>=vPageCount, White()) for the calculated colour expression.
    • Page lable - this is a simple textbox displaying the expression:
      ='Page ' & vPage & ' of ' & Ceil(Count(Distinct Name) / vRows)
  • Create the chart. We need a chart with some sort of ordering such as ranking salespeople by sales volumes. In the example the chart expression is simply Sum(Value), and we will sort by this value. The dimension is the field [Name]. To adapt it to work with the ranking, use the following calculated dimension to limit the values to the current page:

    =Aggr(If(Rank(Aggr(Sum(Value), Name)) >= vRankFrom And Rank(Aggr(Sum(Value), Name)) <= vRankTo, Name), Name)

    (The ranking functions wrap the chart expression (red) returning the dimension values (blue) that fall inside the range specified vt the vRankFrom and vRankTo variables). 
  • On the sort tab, select Sort by "Y-value" descending.
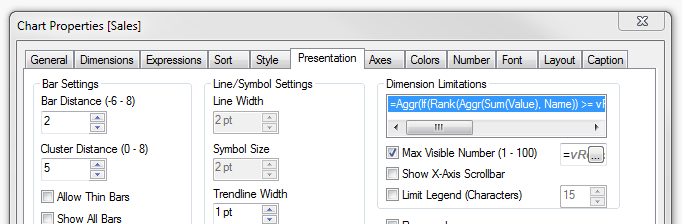
  • One the Presentation tab,  check the "Max Visible Number" box and enter the expression =vRows in the expression box.
Here is a QV document that implements the paging described above:

DataPaging.qvw


Action for previous button
Colour settings for previous button

Max Visible Number setting on Presentation tab


January 5, 2013

Handy data discovery tool

Here's a handy tool to assist in the early development and analysis of the data coming into your Qlikview documents.  There are three objects that you can copy from the attached Qlikview document and paste into your document. You do not need to modify your data model or load script in any way as these objects use standard QV built-in fuctionality.

  • A tree-view list box with the tables and fields in your data model
  • A text box containing summary statistics for the selected field (hidden until a field is selected)
  • A dynamic list box containing the distinct values of the selected field (also hidden until a field is selected)

Here is a Qlikview document containing the 3 objects. Select a field name (any one) to make all three visible and copy from tis document into your Qlikview document.

Data Discovery.qvw

Creating the tools yourself

 If you are using QV Personal Edition, you will not be able to open the attached document, so here is how you can create these objects

The data structure listbox

Create a list box, select in the Field box, and enter the following expression:

=Aggr(Only({1} $Table) & '|' & Only({1} $Field), $Field, $Table)

Then check the "Show as TreeView" option and enter the vertical pipe "|" as the separator.


The text box

Create a text box, and add the following expression:

=Num(Count(Distinct [$(=$Field)]), '# ##0') & ' unique values
' & Num(Count([$(=$Field)]), '# ##0') & ' total values ('
 & Num(Count([$(=$Field)]) / (Count([$(=$Field)]) + NullCount([$(=$Field)])), '0%') & ')
' & Num(NullCount([$(=$Field)]), '# ##0') & ' null rows
' & Num(Count(If(Len([$(=$Field)])=0, [$(=$Field)])), '# ##0') & ' empty values'


On the Layout tab, add the following conditional expression:
Count($Field) = 1

The dynamic list box


Create a list box, select and add the expression:
=[$(=$Field)]

On the Layout tab, add the following conditional expression:
Count($Field) = 1

Conclusion

Remember to select a field in the data discovery list box to see the other two objects. Feel free to use and modify the objects in any way you please. With all the usual disclaimers...


October 16, 2011

Dual values for “self-sorting”

Sometimes you need a field that has a unusual sort order. For example, you might have an a range field that contains values <0, 0-10, 10-100, >100. When you use this field as a dimension in a table or chart, you will want to sort this in the order above. In many cases, this can be done by using the “Load Order” option, but there are cases where the natural load order may not work (calculated fields, for example).

The load order is also of no use if you plan to use the field in a rank expression.

In these case, one option is to create dual values for the field. A dual value contains a text representation and numeric value. Dates are numeric, containing the formatted date and numeric date representation. They display the formatted date, but sort using the numeric value. You can also perform arithmetic on the numeric value. But did you know that you can create your own, custom, dual values?

To do this, use the Dual() function. This is an example of a calculated field using Dual:

LOAD

...

If(IsNull(PaymentAmount) Or PaymentAmount = 0, Dual('None', 0),

If(PaymentAmount > 0.9 * ExpectedInstallment Or IsExempted, Dual('>90%', 90),

If(PaymentAmount > 0.5 * ExpectedInstallment, Dual('50 - 90%', 50),

If(PaymentAmount > 0 Or InSuspense, Dual('0% - 50%', 1),

Dual('Reversal', -1))))) As PayGroup,

…

FROM …

In this example, the load order does not reflect the required sort order, but values of Paygroup will sort according to the numeric value:

Reversal, None, 0% - 50%, 50% - 90%, >90%

Just remember to ensure that the “Numeric Value” sort option is selected when you need this sort order.

August 21, 2011

Howto: Create a Waterfall Chart

A waterfall chart is a type of cumulative bar chart, where each bar begins at the previous cumulative total and has a length equal to the value at that dimension (positive or negative). Something like this:


So, how do we go about this.

CREATE BAR CHART
Create a bar chart with the dimension you require for the X axis, and the following expressions:
  • Total (this is the value for the final, total bar - green in the example above)
  • Value (this is the value for the blue and red bars - rename as appropriate)
  • Cum (this is a hidden value which tracks the cumulative value)
For example, let's have a simple data set with fields Dim1 and Value1. There is a dummy Total with Dim1 = Total, Value1 = 0.

Use the expressions:

  • Total: If(Dim1 = 'Total', Sum(Total Value1))
  • Value: Sum(Value1)
  • Cum: RangeSum(Above(Column(3)), Column(2))

Set Cum to Invisible on the Expressions tab of the chart properties.

MAKE THE WATERFALL

The trick now is to use the bar offset on the Value expression and use this expression:

=If(IsNull(Above(Column(3))), 0, Above(Column(3)))+if(Column(2)<0,Column(2),0)

Click the + sign next to the expression name in the Expressions tab to see the Bar Offset.

That should do it. You can download a demo here : Waterfall demo

To colour the negative values red, set the Background Color for Value to the expression:

=If(Column(2)<0, RGB(200,110,130))

Have fun!

May 30, 2011

Faulty Sorting

I recently had a problem some straight table charts in a model that would allow sorting in only one direction. In other words, double clicking the header would sort by that header, but double clicking again would not reverse the sort direction. In fact, only the direction set in the Sort tab of the chart properties would work.

The chart had normal dimensions and expressions and no apparent reason for this behaviour.

The problem turned out to be that the first expression had been disabled. When I deleted this expression, sorting returned to the normal behaviour.

The lesson I learned here was that if I want to disable an expression during model development, demote it so that it is the last rather than the first expression in the chart.

Using QV 10 SR2

April 25, 2011

Understanding Duals

QV stores all numeric data (numbers, dates, time, intervals, etc) in what is called “dual” format. Understanding dual format may help in overcoming some model pitfalls and may assist in solving some problems.

In brief, a dual format value comprises and numeric value, and a text representation. These may be standard number or date formats, they may be built in series (eg months, days of the week) or any customised series (more on this in a later post). The text representation is the equivalent of a format, but it can be more than that.

To illustrate, the number 40658 could represent:
  • The value 40658. Depending on the format this could be displayed as 40,658 or 40658.00 etc.
  • The date 18 April 2011.
  • A product (or customer or branch or region etc) code 0040658
  • etc

The number 0.65 could also represent:
  • A percentage - 65%
  • The time of day 3:36 pm (0.65 of a day of 24 hours from midnight to midnight)
  • An interval of 15 hours 36 minutes (0.65 of 24 hours)
  • Etc

The format can be created implicitly by QV. During a load, it will infer the format from the source data. If a certain column in a CSV data source contains numbers:

8.35000
9.15000
3.62333

Then QV will infer a format of 0.00000 for that field. Certain QV date and time functions also create the output in the default time and date format for your model.

Taking control – formatting commands

By default, QV will display the text portion of the dual on text boxes, captions, dimension/expression labels and the like, and will use the numeric portion for arithmetic expressions.

You can also manually control this with the Num() and Text() functions. For example, if a field “TimeElapsed” represents an interval with a value of 0.25 (6 hours), then Num(TimeElapsed) will return 0.25 and Text(TimeElapsed) will return 06:00:00 (assuming your default interval format is hh:mm:ss).

Some functions (like Min, Max, Avg) only return the numeric part of the expression, others return a dual value - check the return type in the auto-completion prompts or the documentation.

The formatting commands (Num(), Money(), Date(), Time(), TimeStamp(), and Interval()) allow you to control the text representation. It is worth pointing out that they have no effect on the numeric portion.

For example, Date(40651.65, ‘YYYY/MM/DD’) will display 2011/04/18, but the numeric value is still 40651.65. In other words, the Date function does NOT truncate the fractional part of the value, it simply does not display it. (To remove the time from date/time values, use Floor()).

That provides a very simple conceptual overview of dual values and formatting in Qlikview and I hope it helps with your understanding of dual values.

I will address some of “dual” issues in a little more depth in further posts on this site in the near future. I value your feedback and any topic suggestions or questions.

February 7, 2011

When Totals Don’t Work

Qlikview (QV) provides for three types of totals in straight tables and pivot tables:
  • None
  • The expression calculated at the total level
  • Aggregate function (sum, average, minimum etc) of the table rows

These options cover most cases, but sometimes you have a table where none of these options is appropriate, or provides the correct result. As an example, consider a table of absolute variances, such as budget amount vs selling amount, on a table dimensioned by product class. The expression for the variance and % variance would be:

[AbsoluteVariance] = Fabs(Sum(BudgetAmount) - Sum(SellingAmount))

[%AbsoluteVariance] = Fabs(Sum(BudgetAmount) - Sum(SellingAmount)) / Sum(BudgetAmount)


These expressions yield different results for a different degree of dimensioning, so the sum of the absolute variances per ProductClass is not the same as the absolute variance at the total level. Therefore, the AbsoluteVariance column needs to be totalled using the Sum of rows option. For the %AbsoluteVariance, however, the expression at the total level does not work for the same reason, and the summing of the rows is arithmetically meaningless. In this example, a total is required for both of these columns.

So, how do we construct an expression that will produce the correct %AbsoluteVariance for each row and for the total?

We have the expression for the rows:

[%AbsoluteVariance] = Fabs(Sum(BudgetAmount) - Sum(SellingAmount)) / Sum(BudgetAmount)

For the total, we need an expression like:

[%AbsoluteVariance] = Sum(Rows of AbsoluteVariance) / Sum(BudgetAmount)

Assuming that ProductClass was the only dimension on the table, the Sum(Rows of AbsoluteVariance) can be calculated as follows:

Sum(Aggr(Fabs(Sum(BudgetAmount) – Sum(SellingAmount)), ProductClass))

So, how do we differentiate between the two expressions?

This is where the QV Dimensionality() function comes in. In our case, Dimensionality() will return zero when calculated on the total row, and greater than zero elsewhere. Check the Qlikview Reference Manual for more information on the function.

Our final expression becomes:

If(Dimensionality() = 0,
// total row expression
Sum(Aggr(Fabs(Sum(BudgetAmount) – Sum(SellingAmount)), ProductClass)) / Sum(BudgetAmount),
// other row expression
Fabs(Sum(BudgetAmount) - Sum(SellingAmount)) / Sum(BudgetAmount))

QED

Unzip the download here and play around with a sample QVW model and the Excel source file.

January 12, 2011

A Novel Bookmark Display

This post arose after a client asked for a view of document bookmarks that was similar to a horizontally arranged list box selector. The QV model had a number of states which could be selected using these bookmarks. He wanted his staff to be able to see the selected. The solution looked something like this:

I achieved this as follows:


Step 1: Create the document bookmarks in the normal manner.

Step 2: Open the bookmarks dialog (Bookmarks | More) to get the bookmark Ids for each bookmark. Then uncheck the checkboxes in the “+” column.

Step 3: Create an inline table in the load script with the bookmark names and IDs – something like this:


LOAD * INLINE
[
BMName, BMId
Stock on hand, BM32
Reclaim pending, BM30
Legal hold, BM26
Write offs, BM33
Phyical stock, BM29
Saleable stock, BM31
];


Step 4: Create a list box containing BMName, and arrange horizontally. You can also sort the list box by load order, if appropriate.

Step 5: Add the BMName selection to each bookmark, by selecting the bookmark (from a bookmark control, or the menu. Then select the corresponding BMName value. Finally, click Bookmarks | Replace bookmark to update the bookmark with the BMName selection. I used an open Current Selections box to verify the correct behaviour.

Step 6: (Almost there!) Go to Settings | Document Properties | Triggers and add an On Select trigger on the field BMName. Add a Clear All action, followed by an Apply Bookmark action. For the Bookmark ID for the latter, enter “=BMId” (without the quotes!).

That’s it. Now selecting a value in the “selector bar” for the bookmarks will apply the bookmark and show the currently applied bookmark. Clicking the selected value will clear the bookmark (ie normal list box behaviour).

If you find this useful, or would have any comments on this technique, please post a comment.

October 10, 2010

Qlikview Working Day Functions 3

This post concludes the short series on how to use the working day functions in Qlikview. (Start from the beginning)

Putting it together (IsWorkDay subroutine)

The code below is a subroutine, callable from the load script, that evaluates a date and return true if it is a work day, and false if it is not.

Parameters:
  • testDate (in, date) - the date to test
  • rval (out, true/false) - true if the date is a work date, false otherwise.
Variable vPublicHolidays is a string containing a comma separated list of public holidays. See the earlier post for more information.


Sub IsWorkDay(rval, testDate)
Let zTest = NetWorkDays(MonthStart(testDate), testDate,
$(vPublicHolidays));

// If the day is a non-working day, and there are no
// working days before it in the current month,
// NetWorkDays will return 0

If zTest = 0 Then
rval = false();

// If the day is a working day, and/or there are working
// days before it, NetWorkDays will return > 0
Else
// If the date is the first day of month then it must
// be a work day

If DayStart(testDate) = MonthStart(testDate) Then
rval = true();
// Else compare with NetWorkDay for yesterday. If
// different, then the date is a work day
Else
rval = If((zTest <> NetWorkDays(MonthStart(testDate),
testDate-1, $(vPublicHolidays))),
true(), false());
End If
End If
End Sub;

Put this script on a separate tab on your load script, or in an include file. Then call it like this:


Let vTheDate = Date#('2010/09/22', 'YYYY/MM/DD');
Call IsWorkDay(vTheDate, rval);
If rval Then
... do something if it is a work date
Else
... do something if it is not a work date
End If

The series start page is here.